python 的 numpy.meshgrid 方法
numpy 中的 meshgrid() 函数能够生成坐标网格点,作为后续操作的输入,如画二元函数等高线图等。但它的理解却有些困难,本篇以 Jupyterlab 为平台演示,帮助理解该函数。
直观理解
请看下图,矩阵 (1) 为输入,其中[1, 2, 3] 为 $x$ 轴坐标,[6, 5, 4] 为 $y$ 轴坐标,里面的点 $\cdot$ 为有待求得的网格点。矩阵 (2) 为网格点矩阵,每个元素为该坐标处的 $(x, y)$ 坐标。两个矩阵 ($xv$), ($yv$) 分别为 np.meshgrid() 函数返回的 $x$ 坐标点矩阵和 $y$ 坐标点矩阵。
$$
\begin{matrix}
6 & . & . & . \\
5 & . & . & . \\
4 & . & . & . \\
& 1 & 2 & 3
\end{matrix} \tag{1}
$$
$$
\left[
\begin{matrix}
(1, 6) & (2, 6) & (3, 6) \\
(1, 5) & (2, 5) & (3, 5) \\
(1, 4) & (2, 4) & (3, 4)
\end{matrix}
\right]\tag{2}
$$
$$
\left[
\begin{matrix}
1 & 2 & 3 \\
1 & 2 & 3 \\
1 & 2 & 3
\end{matrix}
\right]\tag{xv}
$$
$$
\left[
\begin{matrix}
6 & 6 & 6 \\
5 & 5 & 5 \\
4 & 4 & 4
\end{matrix}
\right]\tag{yv}
$$
1 | import numpy as np |
1 | x = np.array([1, 2, 3]) |
array([[1, 2, 3],
       [1, 2, 3],
       [1, 2, 3]])
1 | yv |
array([[6, 6, 6],
       [5, 5, 5],
       [4, 4, 4]])
示例
1 | import matplotlib.pyplot as plt |
1 | def circ(x, y): |
1 | x = np.linspace(-np.pi, np.pi, 20) |
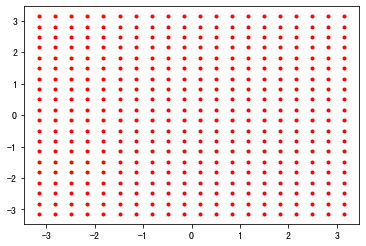
画网格点
1 | plt.plot(xv, yv, marker=".", color="r", linestyle="none") |
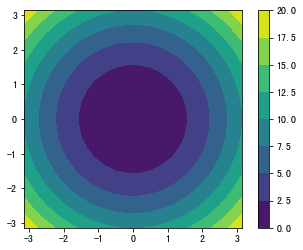
画等高线
1 | plt.contourf(x, y, z) |
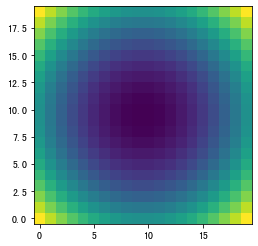
画近似等高线图
1 | plt.imshow(z, origin="lower", interpolation="none") |